Institutional Investors Hub
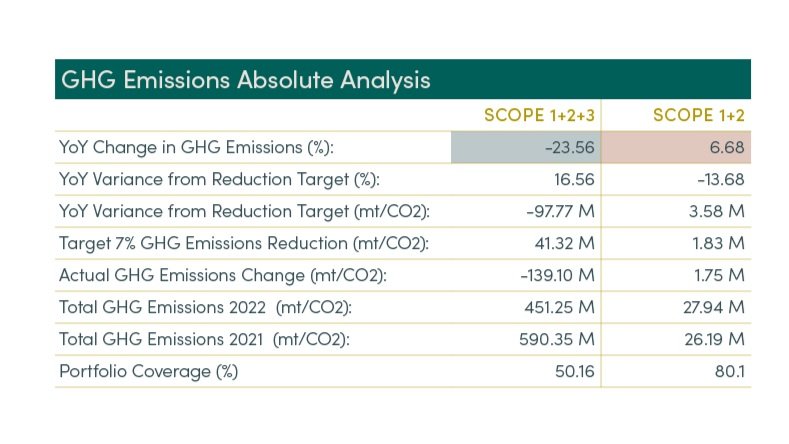
Portfolio Carbon Footprint
Our investments target companies that are on the path to achieving net zero emissions in line with the Paris Agreement. We measure the absolute emissions together with the all important carbon intensity of our investee companies. These metrics are measured across Scope 1+2 and Scope 1+2+3 emissions.
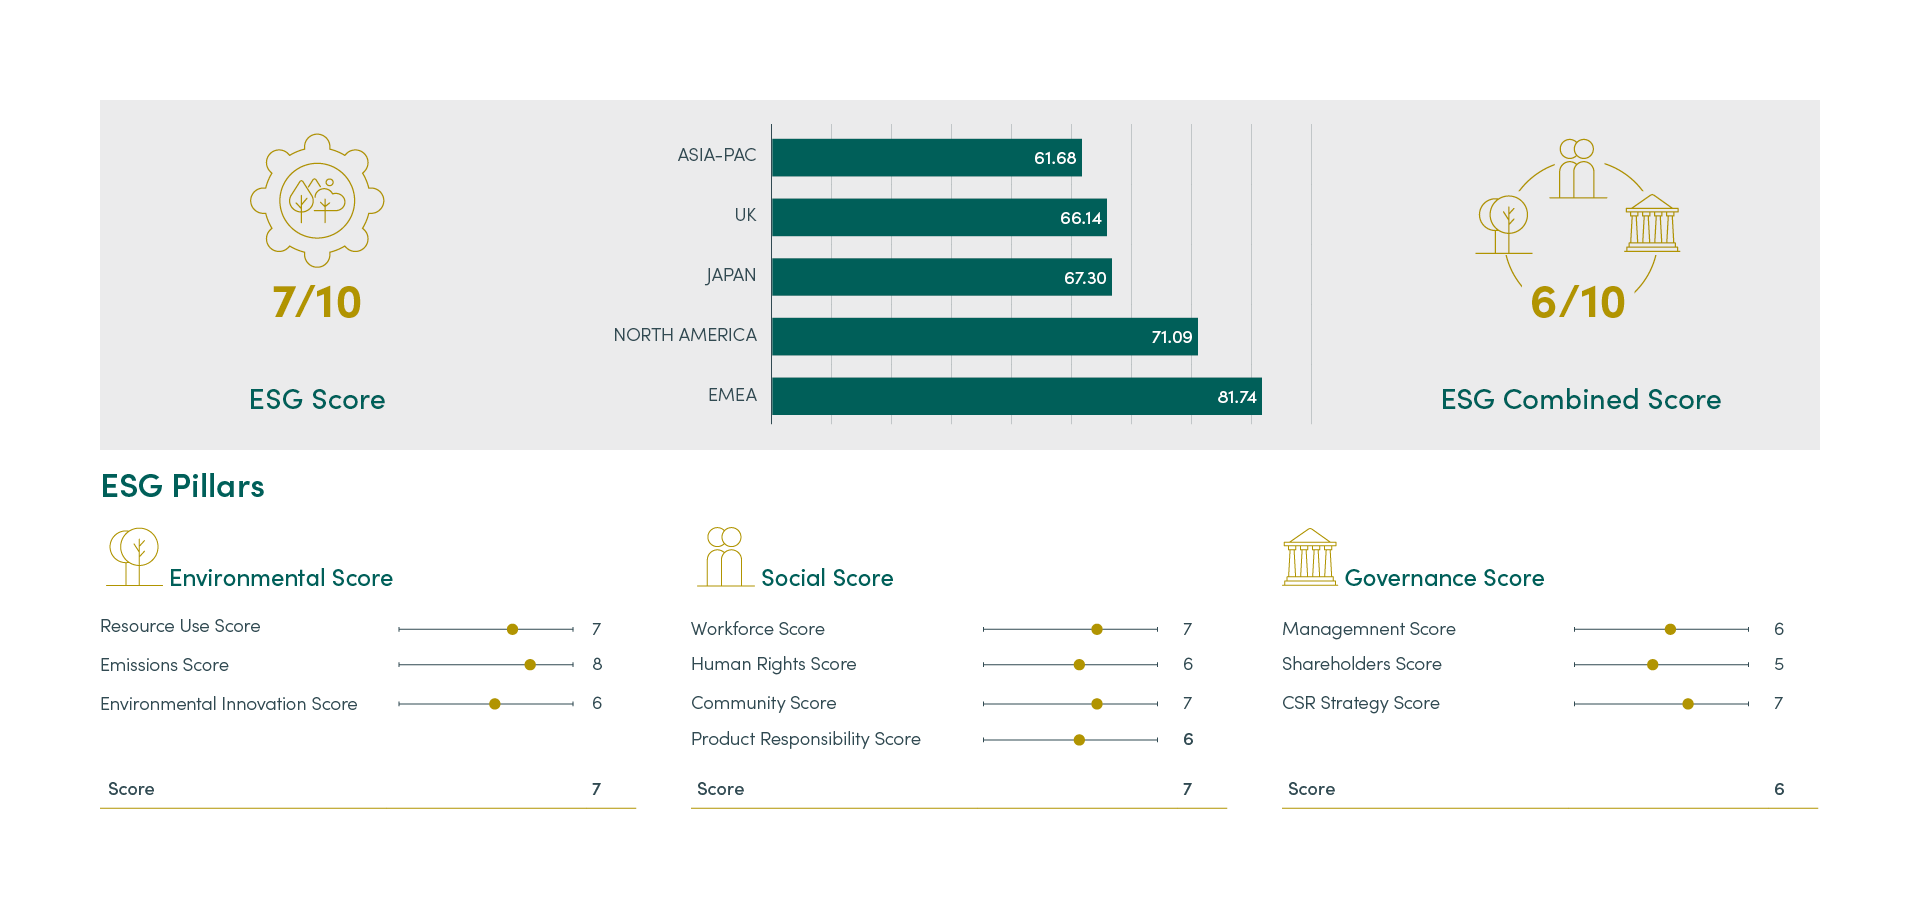
ESG Scorecard
Unlock the Power of Real-Time Climate Finance Analysis
At Emit Capital Asset Management, we are not just navigating the future of climate finance—we are shaping it. Our commitment to transparency and innovation is reflected in our latest offering: real-time data analysis powered by our bespoke dataset and presented through Power BI.
Your Competitive Edge in Climate Finance
Imagine having a customised portal at your fingertips, tailored to your exact requirements, offering unparalleled insights into the markets that matter most to you. Whether you are an Institutional client seeking granular, real-time analysis or a broader view of climate finance trends, our platform is designed to deliver.
Why Partner with Us?
We understand that in the fast-paced world of finance, timely information is critical. That's why we're developing a client desktop portal that provides live feed analysis, 24/7. This isn't just data—it's actionable intelligence that can give you the edge in a rapidly evolving market.
Our platform is more than just a tool; it's a partnership. We are committed to working closely with the right Institutional partners to refine and enhance this offering, ensuring it meets your specific needs. This means you won’t just receive information; you’ll have the power to influence the way it’s presented and used.
What You’ll Gain
- Real-Time Insights: Access live data that’s continuously updated, giving you a minute-by-minute view of key metrics and trends in the climate finance sector.
- Customization: Our portal is built with flexibility in mind, allowing you to tailor the information and analysis to suit your specific strategies and objectives.
- 24/7 Availability: Markets never sleep, and neither does our data. Whether it's early morning or late at night, you’ll have access to the insights you need when you need them.
A Commitment to Transparency
Transparency is at the core of everything we do. By partnering with Emit Capital Asset Management, you gain more than just access to our data—you gain a window into our process, our strategies, and our commitment to driving positive impact through climate finance. We believe that transparency breeds trust, and trust leads to better outcomes for everyone involved.
Powerful Analytics at Your Fingertips
Our real-time data platform allows you to access and analyse a wide range of metrics, providing insights that are both deep and broad:
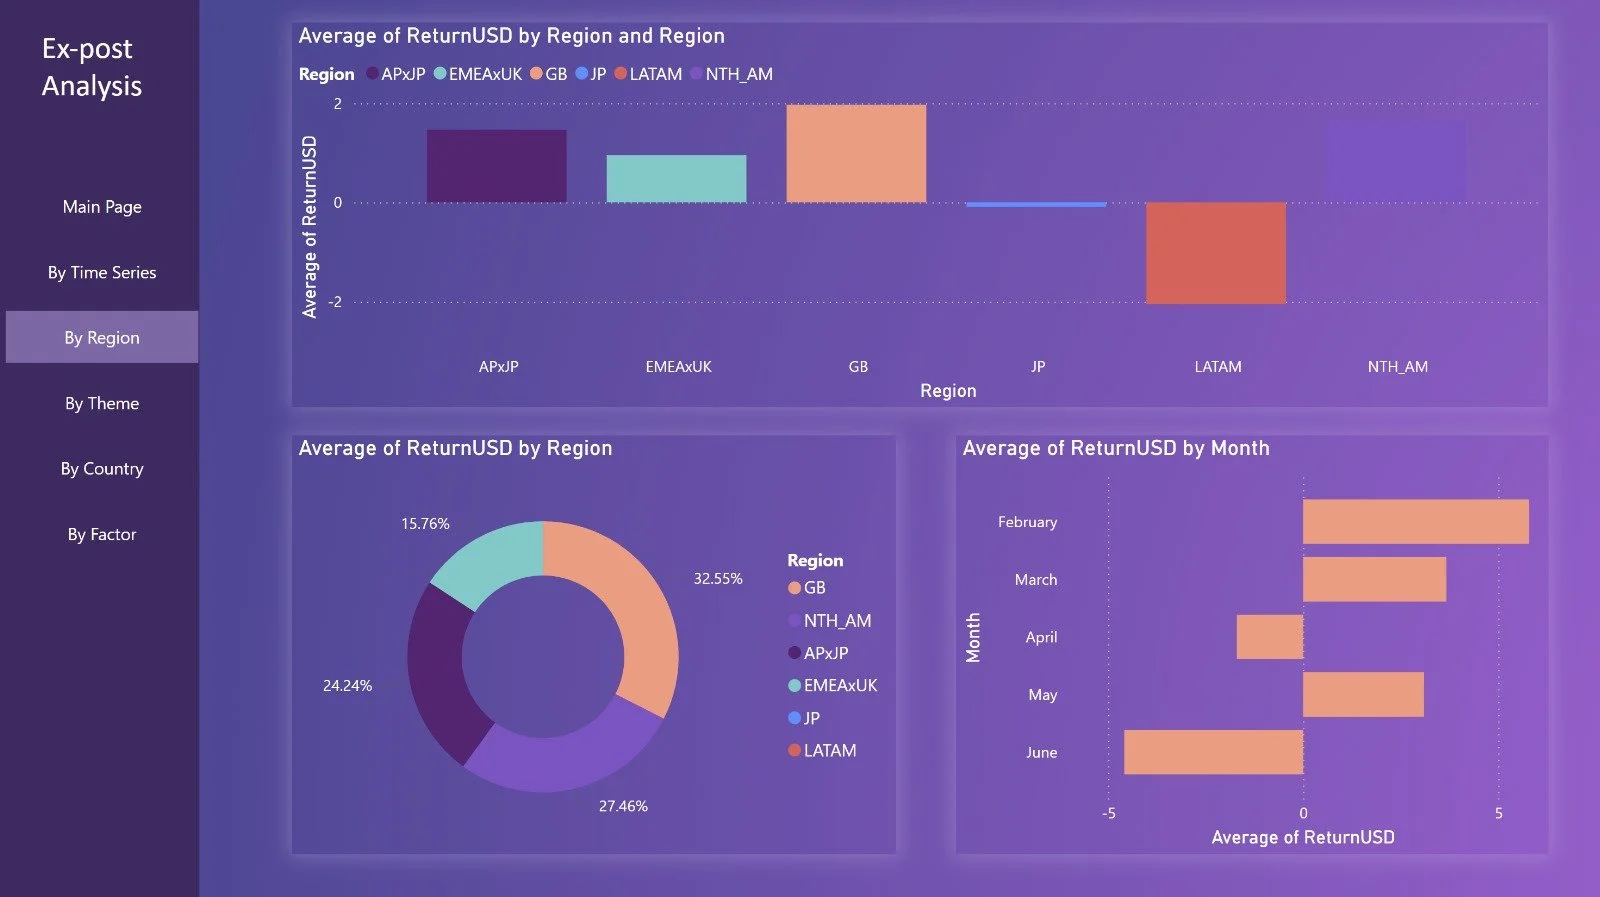
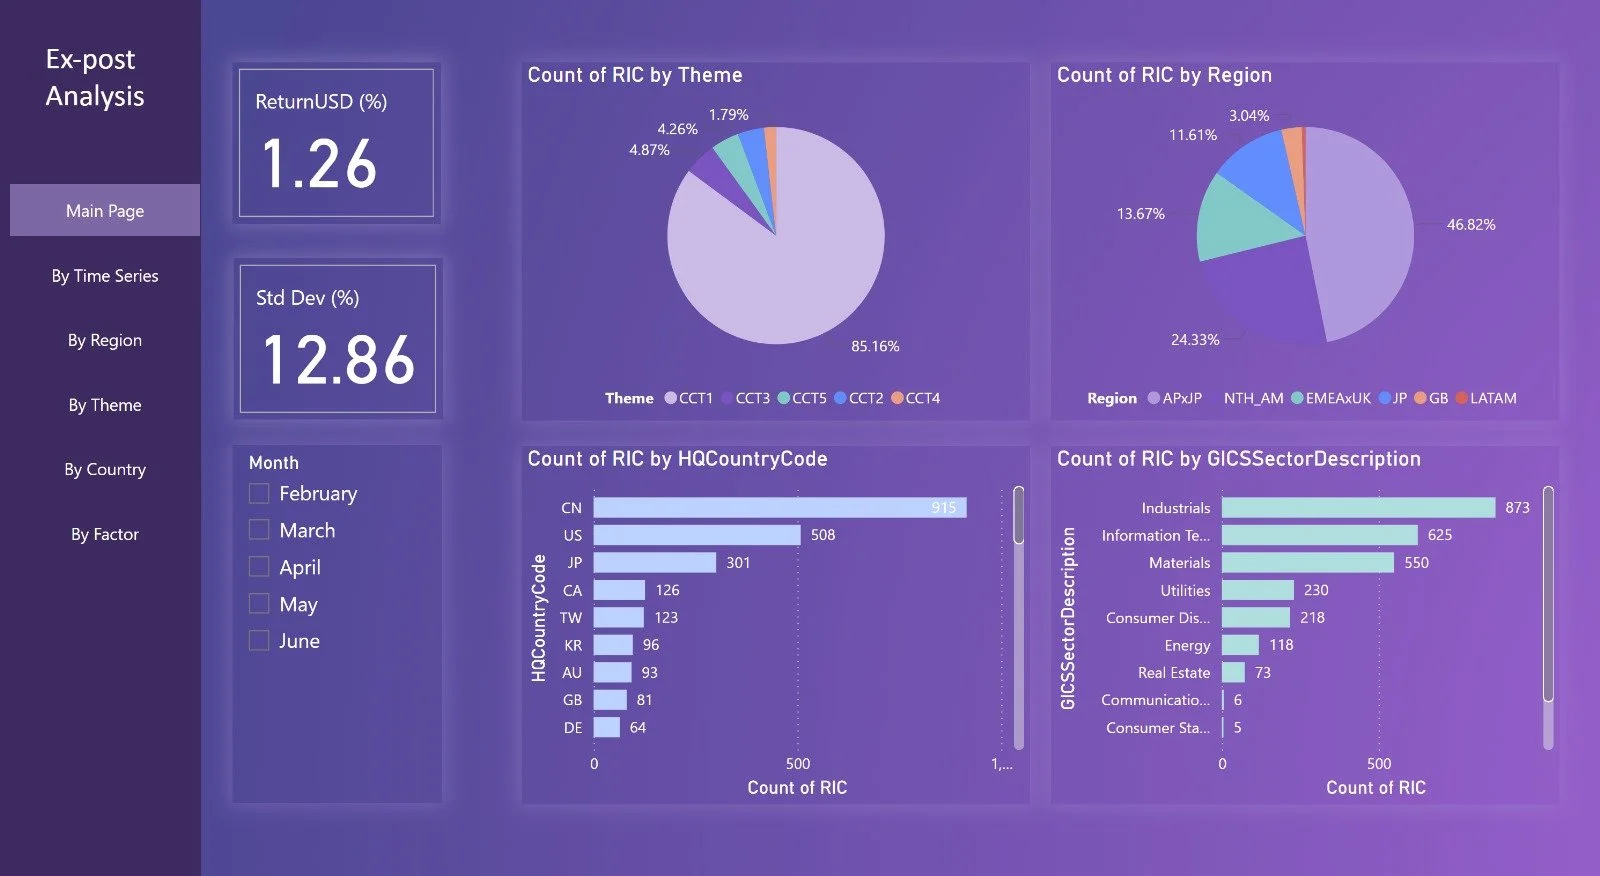
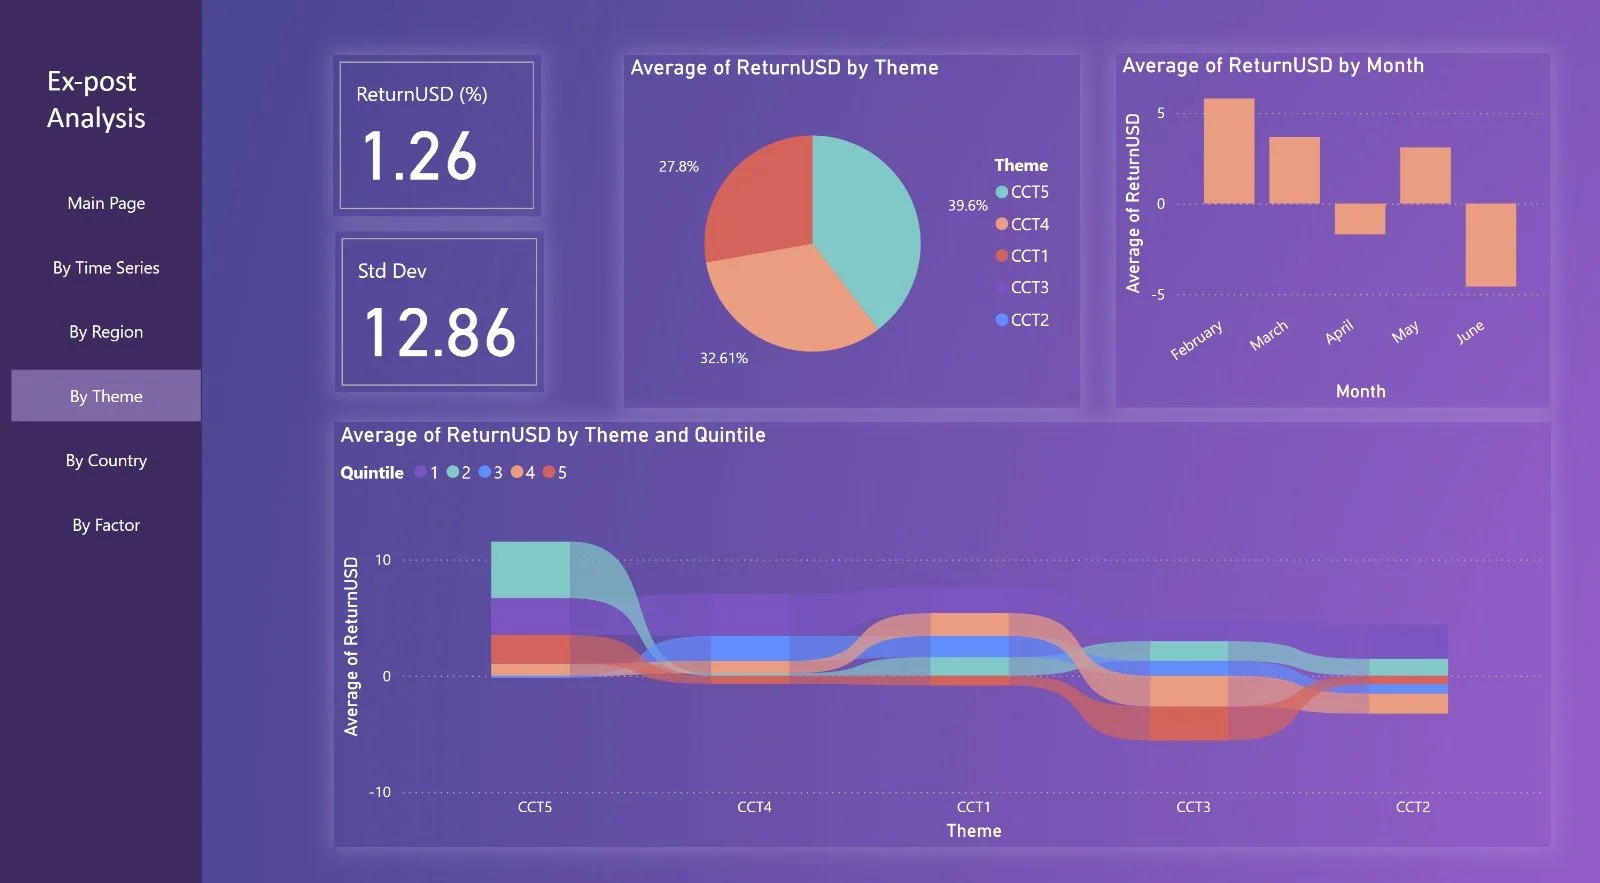
- Equities and Thematics by Country or Region: Visualise how different sectors or themes are performing across various geographies, enabling you to identify trends and opportunities that align with your investment strategy.
- Risk Analysis Data: Assess the risk profiles of various investments, leveraging our data to understand potential exposures and make informed decisions that mitigate downside risk.
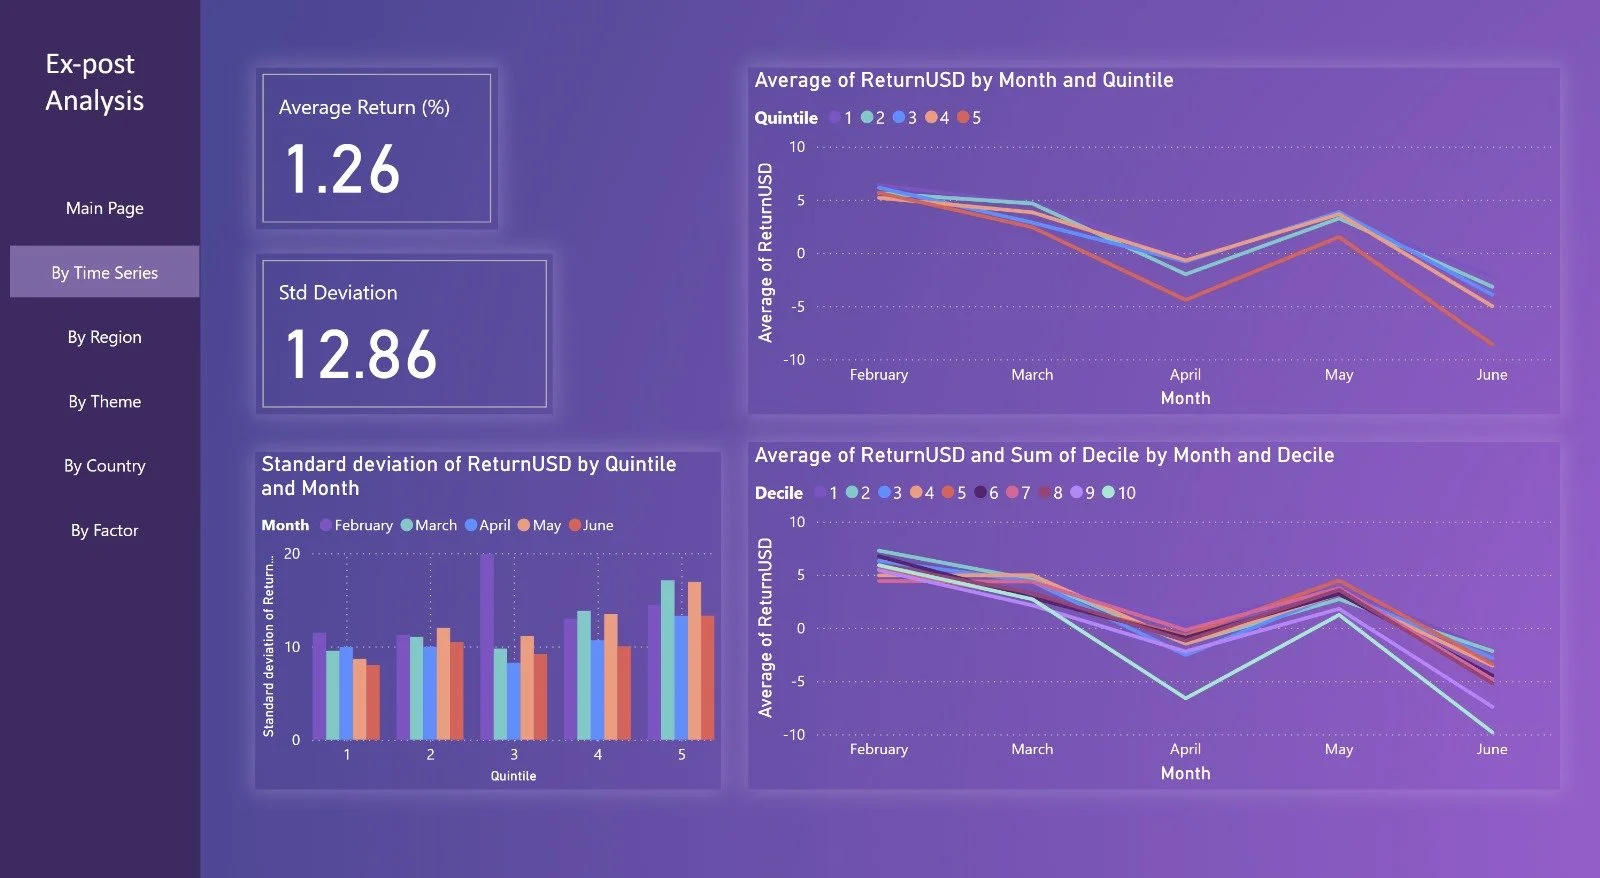
- Historical Performance: Track the historical performance of our fund by theme, region, and sector, gaining insights into past trends that can inform future strategies.
- Sector-Specific Insights: Delve into detailed sector analysis, understanding how different industries are performing within the broader climate finance landscape.
- Customisable Dashboards: Tailor the analytics and visualisations to meet your specific needs, ensuring you always have the most relevant data at your disposal.
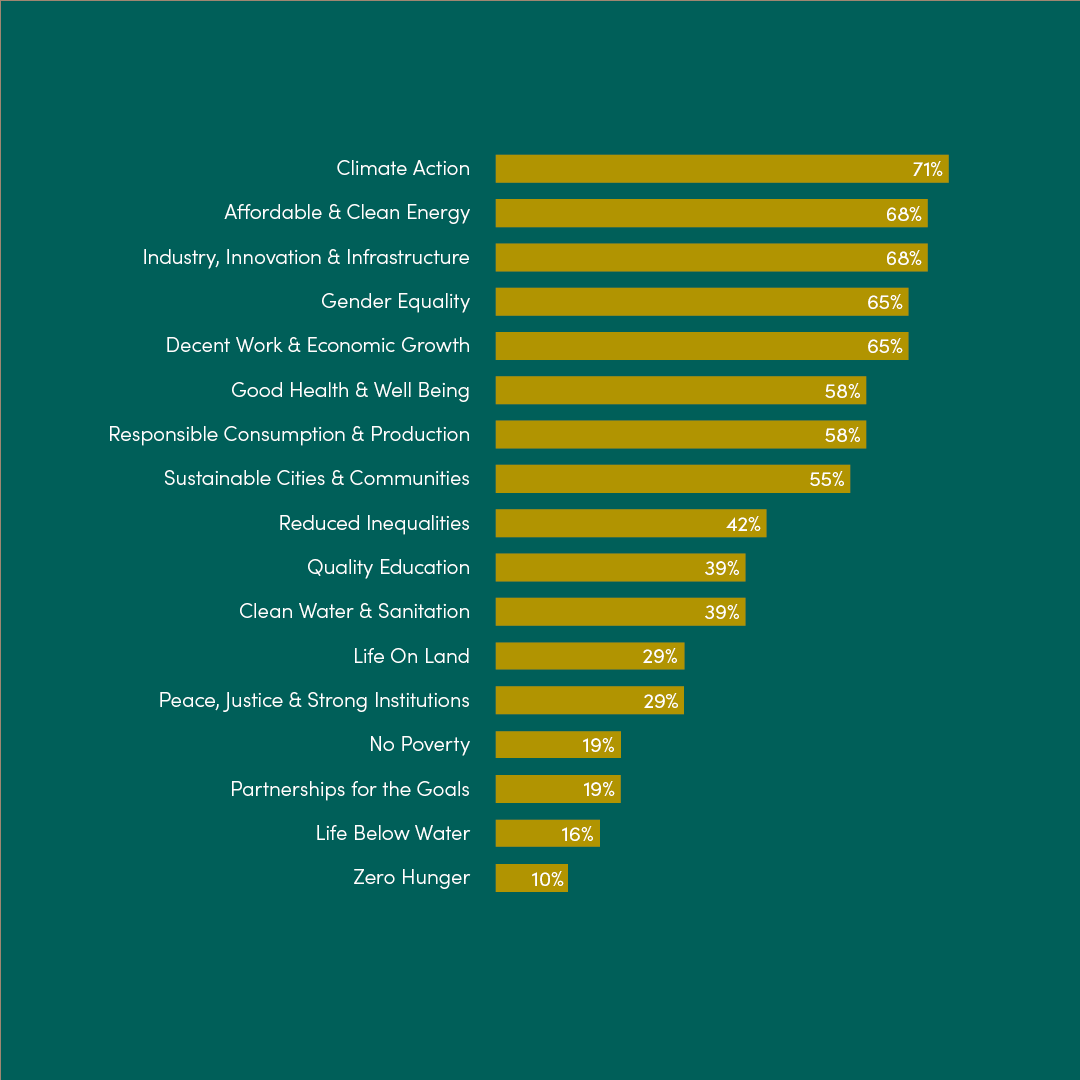
- Live ESG and Impact Reporting: Stay updated with real-time reporting on Environmental, Social, and Governance (ESG) metrics and the overall impact of our fund. This transparency allows you to ensure investments align with your values and stay informed on the positive changes your investments are driving.
See the Future of Finance
Our beta screenshots offer a glimpse into what’s possible with our platform. But this is just the beginning. With your input and collaboration, we are poised to take this to the next level, delivering a truly customised and powerful tool that will set you apart in the market.

The Emit Capital Climate Finance Equity Fund invests in globally listed companies whose activity contributes to a meaningful reduction in climate change.
For more information on Emit Capital’s Responsible Investment Profile, please see our Certified Fund product via The Responsible Investment Association of Australasia (RIAA’s) Responsible Returns website here: Emit Capital RIAA Certified Fund
Energy Transformation
Transport & Infrastructure
Energy Efficiency
Water management
Critical Minerals
One Fund Services Limited (“OFSL”), ACN 615 523 003, AFSL 493421, is the issuer and trustee of the Emit Capital Climate Finance Equity Fund. The material contained in this communication is general information only and was not prepared by OFSL but has been prepared by Emit Capital Asset Management Pty Ltd (“Emit Capital”), an Australian Financial Services Licence holder (AFSL 551084). Emit Capital has made every effort to ensure the accuracy and currency of the information contained in this document. However, no warranty is made as to the accuracy or reliability of the information. Investors should consider the Information Memorandum (“IM”) dated 20 May 2022 issued by OFSL before making any decision regarding the Fund. The IM contains important information about investing in the Fund and it is important investors obtain and read a copy of the IM before deciding about whether to acquire, continue to hold or dispose of units in the Fund. You should also consult a licensed financial adviser before making an investment decision in relation to the Fund. Past performance is no guarantee of future performance. This report does not take into account a reader’s investment objectives, particular needs or financial situation and is general information only to wholesale investors and should not be considered as investment advice and should not be relied on as an investment recommendation.


